




Estimated reading time at 200 wpm: 24 minutes
What is this tool?
Choosing a medical specialty is one of the biggest decisions in your career. Most trainees weigh up several factors: how competitive is it? Will I enjoy the work? Does it fit my life? Where are the jobs? The tool is presented at the end of this guide for a reason – read on. You can head there now and play around with it. You cannot ‘break it’. However, if you do not understand it or what you are doing, then tough – you end up wasting your time or risk making a very poor decisions. This tool helps you think through trade-offs systematically. It combines hard data (competition statistics) with your own priorities and preferences to produce a personalised ranking of specialties you’re considering. If you’re a luddite, leave this alone.
Whether or not you agree our Fat Disclaimer applies
Think of it as a flight simulator for medical career decisions. You can adjust the controls, see how the rankings shift, and explore different scenarios — all without committing to anything. There is no live tutorial on this. Those who know the author may give feedback by email. The author does not provide support. THE TOOL IS NOT PERFECT! It provides a way of playing with preferences that are built on data and you inputs, to give a rough estimate. You should always seek independent career advice. If you make decisions based on this tool and your future turns out to be a mess, you sue yourself!
The code behind the tool is copyrighted. Use of the tool is free of charge. No obligations.
The problem with competition ratios alone
The NHS publishes competition ratios each year. A ratio of 10:1 means ten applicants for every post. Sounds straightforward.
But ratios can mislead. Consider two specialties:
- Specialty A: 100 applications, 10 posts (ratio 10:1)
- Specialty B: 1,000 applications, 100 posts (ratio 10:1)
Same ratio. But Specialty B has ten times more posts. Your absolute chances of getting a post are better there, simply because there are more opportunities.
Competition ratios also ignore everything else that matters: whether you’d actually enjoy the work, whether the lifestyle suits you, where the jobs are located, and so on.
This tool addresses both problems.
How the statistics work
Competition Ratio (CR)
This is the standard measure:
CR = Applications ÷ Posts
Higher numbers mean more competition. A CR of 20 means twenty people chasing each post.
Expected Success Probability (ESP)
This flips the ratio to show your raw odds:
ESP = Posts ÷ Applications = 1 ÷ CR
A CR of 20 gives an ESP of 0.05, or 5%. That’s your baseline probability of success, assuming all applicants are equally competitive.
Best Bet Score (BBS)
This is where things get more useful. BBS adjusts for the scale of opportunity:
BBS = (Posts ÷ Applications) × √Posts
The square root of posts acts as a scaling factor. Specialties with more posts get a boost, because more posts means more chances.
What BBS tells you:
- BBS ≥ 5 → Statistically safe. Large post numbers, reasonable odds.
- BBS 1–5 → Moderate. Selective but achievable.
- BBS < 1 → High risk. Few posts, many applicants. A bottleneck.
General Practice ST1, for example, has a BBS around 13. The Dual CCT GP/Public Health programme has a BBS below 0.1. Same “GP” label, wildly different statistical reality.
How the tool works: Two types of controls
The simulator has two separate sets of sliders. Understanding the difference is essential.
Global Weightings (left panel)
These answer: “How much do I care about each factor?”
This is about your priorities as a person. If work-life balance matters more to you than money, you’d set Lifestyle higher than Earnings. If getting into training at all is your main concern, you’d set Statistical Odds (BBS) high.
These percentages represent the relative importance of each factor to you. They sum to 100%. If you set all sliders to the same position, each factor contributes equally (~17% each). If you push one slider up, its percentage rises and the others fall proportionally.
These weights stay constant across specialties because your personal values don’t change just because you’re evaluating a different training pathway. A trainee who cares deeply about lifestyle will care about lifestyle whether looking at GP or Neurosurgery.
Per-specialty ratings (right panel, within each specialty card)
These answer: “How does this specific specialty score on each factor?”
This is your assessment of the specialty itself. You might rate Emergency Medicine as 90 on Job Satisfaction (because you love acute work) but only 30 on Lifestyle (because of antisocial hours). For GP, you might reverse those numbers.
These ratings will differ between specialties. That’s the point. Each specialty has its own profile of strengths and weaknesses, and your subjective ratings capture how you perceive them.
How they combine
The utility score multiplies your ratings by your weights and sums the result.
A simplified example with two factors:
- Your weights: Fit = 70%, Lifestyle = 30%
- Emergency Medicine: Fit = 90, Lifestyle = 30
- GP: Fit = 50, Lifestyle = 80
Emergency Medicine utility: (0.7 × 90) + (0.3 × 30) = 63 + 9 = 72 GP utility: (0.7 × 50) + (0.3 × 80) = 35 + 24 = 59
Emergency Medicine wins because your weights prioritise Fit, where EM scores higher.
If you changed your weights to Fit = 30%, Lifestyle = 70%:
Emergency Medicine: (0.3 × 90) + (0.7 × 30) = 27 + 21 = 48 GP: (0.3 × 50) + (0.7 × 80) = 15 + 56 = 71
Now GP wins because you’ve prioritised Lifestyle.
This is the flight simulator in action. You can see how different priorities reshape the outcome.
A worked example: Cardiothoracic Surgery ST1
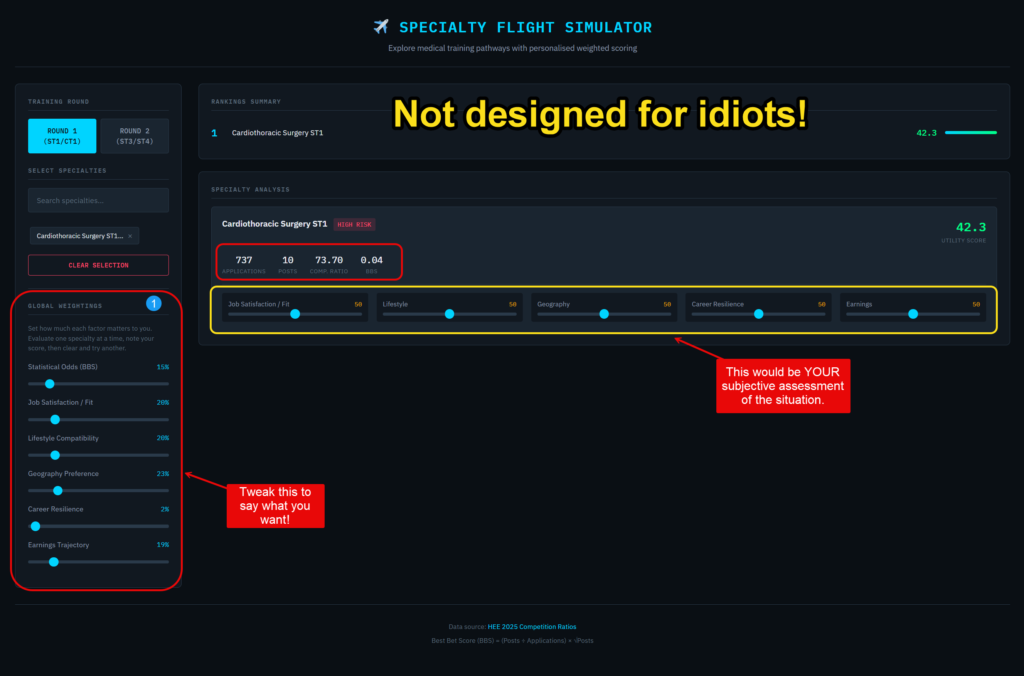
Suppose you’ve set your Global Weightings as follows:
- Statistical Odds (BBS): 14%
- Job Satisfaction / Fit: 21%
- Lifestyle: 22%
- Geography: 22%
- Career Resilience: 2%
- Earnings: 19%
This says you care most about Lifestyle and Geography, moderately about Fit and Earnings, somewhat about statistical safety, and very little about long-term career resilience.
You then select Cardiothoracic Surgery ST1. The tool shows:
- 737 applications for 10 posts
- Competition ratio: 73.70
- BBS: 0.04 (extremely low — this is a statistical bottleneck)
The per-specialty sliders all start at 50 (neutral). Your initial utility score is 43.1, which is low. Why?
Because the BBS is terrible (near zero on the normalised scale), and you haven’t yet told the tool how you assess this specialty on the other factors. The 50s are placeholders, not your opinion.
Now you rate Cardiothoracic Surgery honestly:
- Job Satisfaction / Fit: 95 — You’ve wanted to be a cardiothoracic surgeon since medical school. This is your calling.
- Lifestyle: 20 — You know the training is brutal. Long hours, heavy on-call, years of intense commitment.
- Geography: 40 — Only 10 posts nationally. Limited choice about where you’d live.
- Career Resilience: 70 — Cardiac surgery isn’t going away. Demand is stable.
- Earnings: 85 — Consultant earnings are high, private practice is lucrative.
With these ratings, your utility score changes. The high Fit (95) helps, but your weightings give Lifestyle 22% importance and you’ve rated it at 20. That drags the score down significantly.
The tool is now showing you the trade-off: you love this specialty, but the lifestyle cost is high and you’ve said lifestyle matters to you.
If you changed your Global Weightings to prioritise Fit above all else (say, 50%), the score would rise because you’d be telling the tool “I care most about doing work I love, even if the lifestyle is hard.”
This is the point of the simulator. It doesn’t tell you what to choose. It shows you the consequences of your own priorities.
The five subjective factors
Each specialty is rated on five dimensions beyond the statistical odds:
Job Satisfaction / Fit
How much does this specialty align with your interests, identity, and what you find meaningful in medicine? Would you look forward to the work?
Lifestyle Compatibility
What are the rota patterns like? How much on-call? How compatible is it with family life, hobbies, or other commitments?
Geography Preference
Where are the training posts located? Are they in regions you’d want to live? How much competition is there for posts in your preferred location?
Career Resilience
How future-proof is this specialty? Is demand likely to grow or shrink? How adaptable are the skills to other roles if circumstances change?
Earnings Trajectory
What’s the realistic earning potential as a consultant? Is there scope for private practice? How does it compare to other specialties?
You rate each specialty from 0 to 100 on each factor. Start at 50 (neutral) and adjust up or down based on your honest assessment.
How the utility score is calculated
The tool combines everything into a single Utility Score for each specialty.
Here’s the process:
- Normalisation: All scores are converted to a 0–1 scale so they can be compared fairly. BBS is normalised relative to the specialties you’ve selected. Subjective scores are already on a 0–100 scale, so they’re simply divided by 100.
- Weighting: You set global weights for how much each factor matters to you. These weights automatically adjust to sum to 100%.
- Calculation: Each factor’s normalised score is multiplied by its weight, and the results are summed:
Utility = (w₁ × BBS) + (w₂ × Fit) + (w₃ × Lifestyle) + (w₄ × Geography) + (w₅ × Resilience) + (w₆ × Earnings)
- Ranking: Specialties are sorted by their utility scores. Higher is better.
The final score is scaled to 0–100 for readability.
How to use the tool
Step 1: Set your global weights first
Before selecting any specialty, adjust the Global Weightings sliders to reflect your personal priorities. Ask yourself: what matters most to me in a career? Statistical safety? Job satisfaction? Lifestyle? Earnings?
These weights will apply to every specialty you evaluate, so set them once based on who you are.
Step 2: Choose your round
Select Round 1 if you’re applying for ST1/CT1 entry-level training posts.
Select Round 2 if you’re applying for ST3/ST4 higher specialty training.
Step 3: Select one specialty
Use the search box to find a specialty you’re considering. Click to add it.
The specialty card appears showing its raw statistics (applications, posts, competition ratio, BBS) and sliders for your subjective ratings.
Step 4: Rate that specialty
Adjust the five subjective sliders based on your honest assessment of this specific specialty. Start at 50 (neutral) and move up or down.
Ask yourself:
- Would I enjoy this work day-to-day? (Job Satisfaction / Fit)
- Does the lifestyle fit what I want? (Lifestyle)
- Are the training posts in places I’d live? (Geography)
- Is this specialty likely to remain in demand? (Career Resilience)
- Am I comfortable with the earning potential? (Earnings)
Step 5: Note your score
The utility score appears in the top right of the specialty card. This number reflects how well this specialty matches your stated priorities and your assessment of it.
Take a screenshot or write down the score.
Step 6: Clear and repeat
Click “Clear Selection” to reset. Then select your next specialty and rate it fresh. Your global weights remain unchanged, but your subjective ratings start at 50 again because this is a different specialty.
Repeat for each specialty you’re considering.
Step 7: Compare your results
Once you’ve evaluated several specialties independently, compare the scores you recorded. Higher scores indicate better alignment with your priorities.
Remember: these scores are only as good as your inputs. If you’re unsure about a specialty’s lifestyle or earnings, talk to trainees and consultants who actually work in it.
Interpreting the results
Utility Score
A number from 0 to 100. Higher means better alignment with your stated priorities and your ratings of the specialty.
The score combines:
- The specialty’s statistical position (BBS) relative to all training pathways
- Your subjective ratings of the specialty on each factor
- Your global weights determining how much each factor matters
A score of 75 doesn’t mean “75% chance of happiness.” It means this specialty achieves 75% of the maximum possible score given your inputs.
Comparing across specialties
Because BBS is normalised against the entire dataset (not just your selections), scores are directly comparable. A score of 70 for Radiology and 65 for Anaesthetics means Radiology aligns slightly better with your priorities — assuming you rated both honestly.
Risk Bands
Each specialty card shows a risk label based on BBS:
- SAFE (green): BBS ≥ 5 — large post numbers, reasonable odds
- MODERATE (amber): BBS 1–5 — selective but achievable
- HIGH RISK (red): BBS < 1 — few posts, many applicants
This label is independent of your weightings. A high-risk specialty might still score well if you’ve weighted Fit heavily and rated it highly. The label just reminds you of the statistical reality regardless of how much you care about it.
Limitations and caveats
The data is from one recruitment cycle
Competition ratios change year to year. A specialty that was competitive this year might be less so next year, or vice versa. Use the data as a guide, not a guarantee.
Your subjective ratings are guesses
You’re rating specialties based on what you know or believe about them. That knowledge might be incomplete or wrong. Talk to trainees and consultants in specialties you’re considering. Update your ratings as you learn more.
The model is simplified
Real career decisions involve factors this tool doesn’t capture: specific programme reputation, supervisor quality, research opportunities, exam pass rates, portfolio requirements, and more. The tool is a starting point for thinking, not a replacement for it.
Utility scores are not probabilities
A utility score of 75 doesn’t mean 75% chance of success or satisfaction. It’s a weighted average of your ratings. Two very different specialties could have similar scores for different reasons.
Final thoughts
The purpose of this tool is to help you think more clearly, not to make the decision for you.
By evaluating specialties one at a time, you’re forced to consider each on its own merits. The scores give you a consistent basis for comparison, but they’re only as good as your self-knowledge.
If you find yourself wanting to inflate your ratings for a particular specialty to push its score up, that’s a signal — maybe you’ve already made your decision and just want validation.
If a specialty scores poorly despite your best efforts to rate it fairly, that’s also a signal worth noticing.
The best use of the simulator is to surface trade-offs you might not have consciously considered. Play with the global weights. See how sensitive your results are to different priorities. And then go talk to people who actually do the jobs you’re considering.
Good luck.
Data source: NHS England 2025 Competition Ratios
Tool concept developed via collaborative exploration. Free to use and share.
Explore medical training pathways with personalised weighted scoring
Select specialties to begin your flight simulation
Detailed breakdowns will appear here